
The Cost of Accuracy – Resource Cost Rates
During a Professional Services Automation (PSA) implementation, every organization has the opportunity to review established practices, revisit existing processes and roles, and challenge the status quo. For service companies that are new to a PSA system, the definition of the resource cost, or average “cost rate” typically drives a lot of discussion. But rarely do companies discuss the cost of accuracy when choosing to use an average resource cost rate versus an actual cost rate.
In PSA, the “default cost rate” field on the resource record represents the default resource cost for that particular person and will be used in cost calculations on projects. As such, it has a crucial impact on project profitability calculations and analysis.
Reasons Why Companies Use Actual Resource Cost Rates
At CLD, we see some of our customers using real resource salary information sourced from the workforce management system to derive resource cost rates in PSA. Excluding some business that might require real resource cost information (i.e. some government related businesses), here are common situations we see with new clients:
- Using real cost is the natural starting point for new organizations, however, now the organization is growing fast, and still operates as small shop with very centralized and siloed mentality. This is a risky place for the company to stay for a long period of time, and overcoming this phase is crucial for the success of the entire organization.
- Project profitability has to be as accurate as possible. The rationale behind it is that every penny counts. Although this is true, there is a cost associated with micromanaging “real cost” that might be more expensive. And, what’s more concerning, the cost of micromanaging real cost is unknown to the organization. (Harvard Business Review agreed with us “Eventually, we posited, the returns would become negative as the quest for ever greater accuracy consumed resources and distracted managers from initiating timely actions.“)
- Resource salary is easy to calculate. Sourced from the Human Capital Management (HCM) system, there is little to no transformation required from one system to another. However, this approach raises privacy concerns due to the sensitivity of this information since its derived from salary information, forcing the organization to hide fields from some PSA users, design processes around this limitation, and introduce a level of complexity that is not necessarily required. What’s even more concerning, sometimes Project Managers are compensated on project profitability, but they are not allowed to see or manage the project profitability due to the sensitivity concerns.
Why You Should Consider Using Average Cost Rates
In our experience, most all companies experience an inflection point during the scaling up process where the difference between an actual cost rate and an average cost rate (or blended cost rate), measured across the whole of the enterprise, doesn’t justify the time and associated cost of using actual cost rates in PSA.
CLD usually advocates using an average resource cost or blended cost to calculate default cost rates, which:
- Provides nearly accurate profitability at the project level.
- Provides entirely accurate profitability at the enterprise level.
- Avoids the exposure of sensitive human resource data, such as salary.
- Eliminates the complexity of system design, development, and maintenance required to use actual cost rates while simultaneously hiding them from most users.
Using average cost rates will provide organizations with project cost accurate enough to understand profitability, but blended enough to avoid privacy issues. In combination with other PSA processes to be implemented as part of the PSA deployment, this could also replace existing reports and processes that are conducted on a monthly basis.
What Does an Average Cost Rate Really Mean?
With an average cost rate approach, the resource’s cost rate is an average of the labor cost for similar resources in terms of predefined variables. A common example of these variables would be resource’s location, band and role. The average logic can be expanded to include other attributes if the organization considers it necessary, but it is important to keep the logic as simple and straight forward as possible.
CLD hears many reasons why clients want to use real cost rates. One reason often shared is the impact on project profitability during the staffing process, or later on when swapping resources during delivery. However, when the blended rates are calculated properly, the impact should not be material enough to justify the complexity required to use actual cost rates in PSA while simultaneously hiding them from most users. This is especially true when highly compensated managers are in charge of managing these staffing decisions, and the time consumed in managing to the penny is much more expensive than the savings during staffing or swapping resources.
Blended cost rates elevate the maturity level of the staffing process by allowing managers to make decisions focusing on the resources ability to fulfill an open position, instead of focusing on the cost factor. This is an important switch from cost-oriented to delivery-oriented organizations.
Analyzing Actual Cost Rates vs. Average Cost Rates
(Note: Several images illustrate our examples below. Click on an image to see it larger or contact us for the spreadsheet with the calculations and formulas used in these examples.)
From a holistic view, the impact of managing actual labor cost in projects or average labor cost likely is a zero-sum proposition for the company. The example below shows that using specific (actual) resource cost rates or blended cost rates results in the same margin percentage for the project. 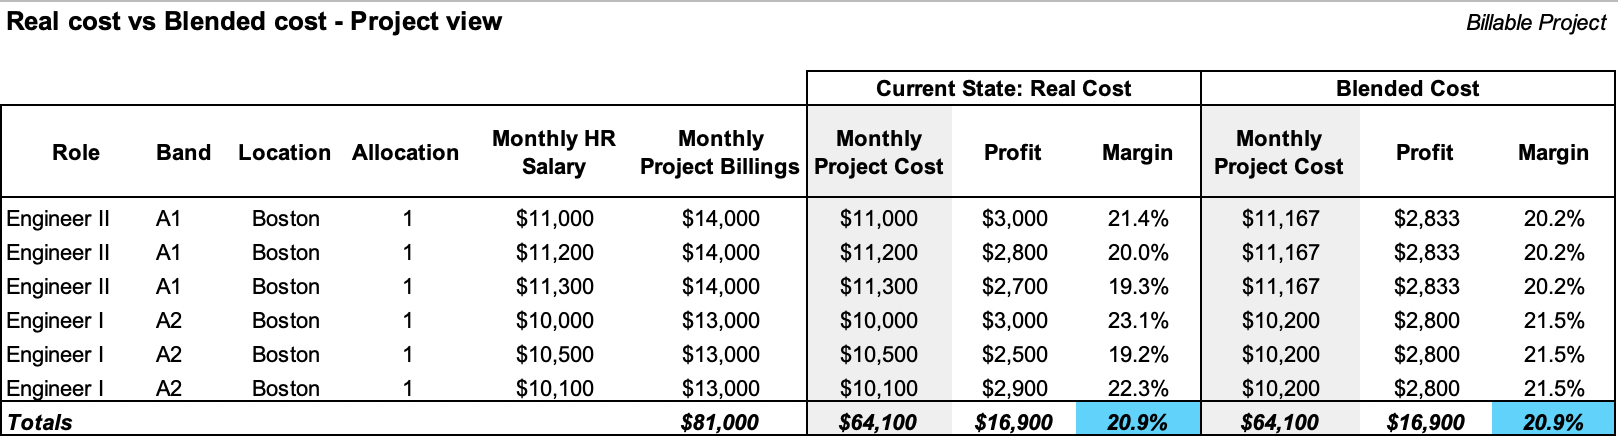
In the model above, the following average rates were applied (average by band by location, typically calculated once a year):
- Engineer II | A1 | Boston | $11,167
- Engineer I | A1 | Boston | $10,200
The blended rates calculation simply averages the resources’ real labor cost, by location and by band. The example above has only one location, to simplify the exercise. But the same is valid for multiple locations, since the blended rates are calculated by location (and by band and role). As the example illustrates, it is exactly the same from a total profitability standpoint if we use real labor cost or average labor cost. This example illustrates what this company as a whole looks like if using a blended rate model.
How Does Swapping Resources Affect the Calculations
Continuing with the example above, we can introduce a resource swap and analyze the impact.
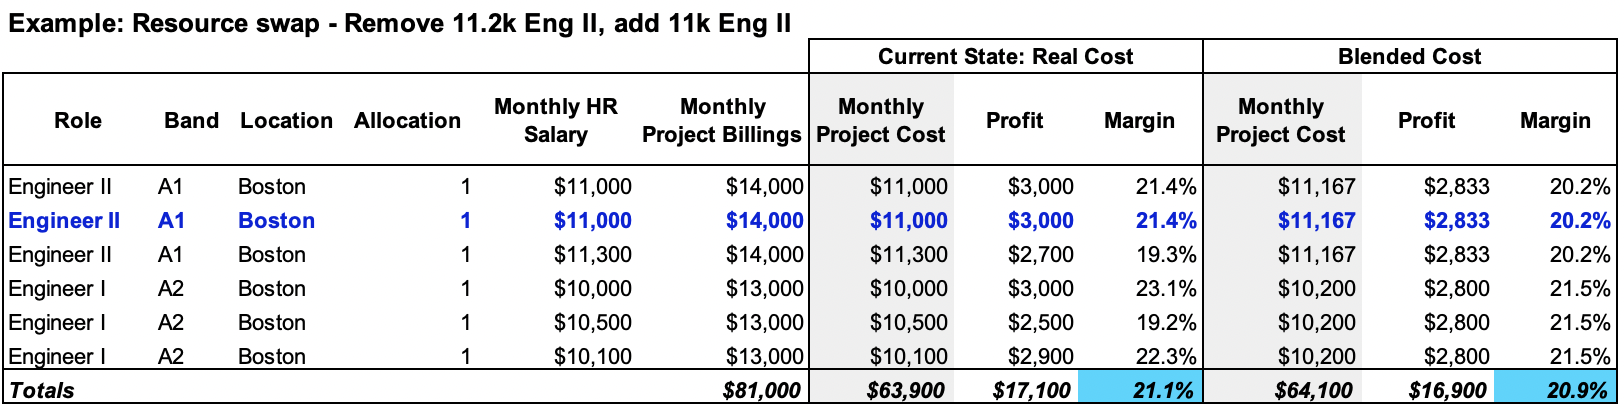
As it illustrates above, swapping a resource that is on the same location and band creates such a small profitability impact that overall doesn’t necessarily change the course of the project. The hidden cost for this company to manage the real cost could potentially be higher than the financial saving of the swap.
Another example shows what would happen in a resource swap, when the new resource is from a lower cost location: 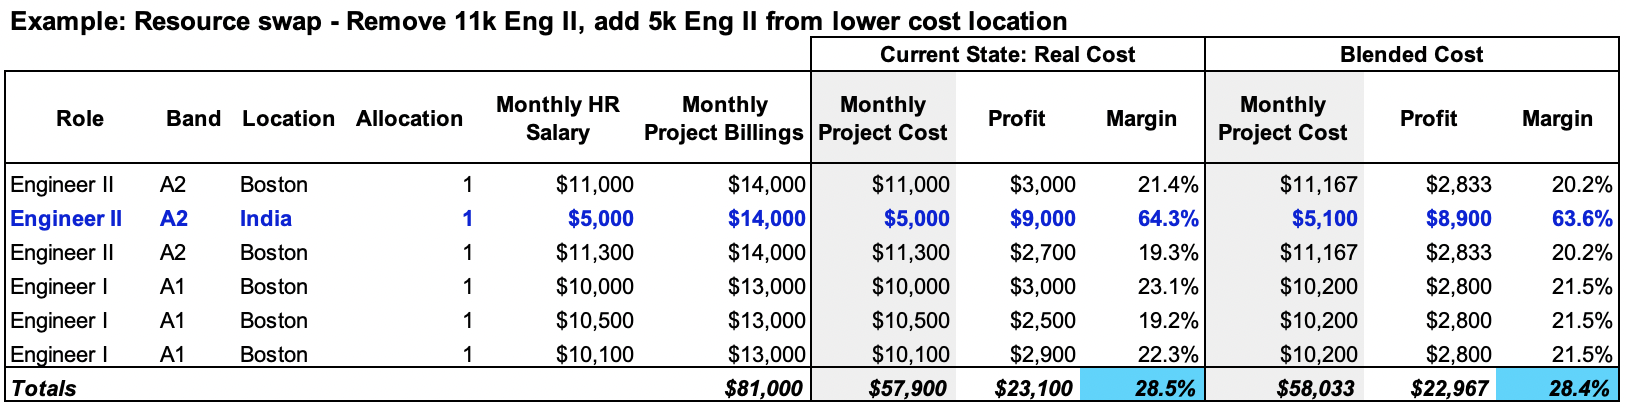
Again, the difference in the project profitability is nominally different in the example above and, therefore, immaterial.
In summary
Using blended rates instead of the real resource cost could provide enough visibility to drive project profitability decisions without exposing real compensation information. If the level of resource swaps is considerably high, then most likely the difference between rates evens out over time making the difference in the costing model even less material.
Simple Average Cost Rate Model for Enterprises
Ok, so you’re ready to use an average cost rate, but you need a more robust model than the example above.
When setting up a mature model, organizations investigate a more robust blended cost approach. These models include other variables in the calculation of average cost rates. The example that follows starts with a set of assumptions about number of hours, PTO and holidays:
- Location : Boston
- Hours per work day : 8
- Paid hours per year : 2,080
- Holidays per year : 5
- Paid Time Off Days per year : 15
- Available Hours per year : 1,920
The model adds in other natural expenses on top of the labor cost:
- Non-billable expenses, like training or company meetings
- Other cost, like phone, internet, etc.
- Overhead: This represents the cost of resources in delivery but not billable to the customer, i.e. regional delivery managers, delivery operations, etc. The overhead cost in this model is allocated to the customer-facing resources.
A target utilization percentage per band drives the number of hours that are expected to be utilized as well.
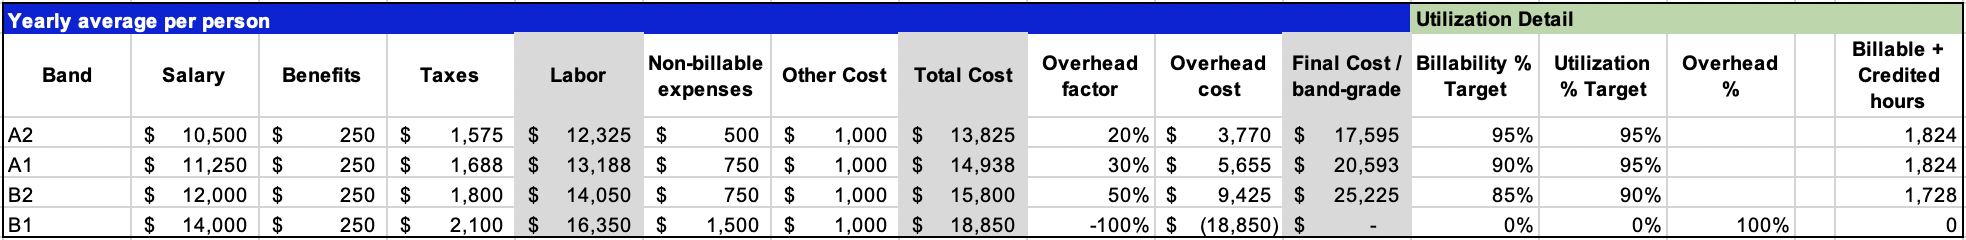
The second part of the model comes from the expected FTEs per band.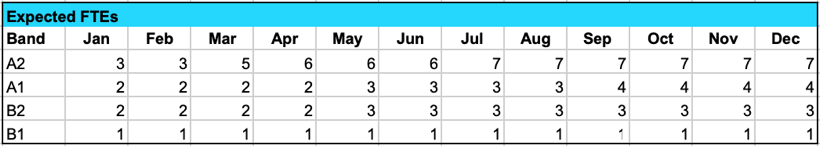
Merging it together, the model drives hours by band and cost by band, thus yielding a blended rate by band.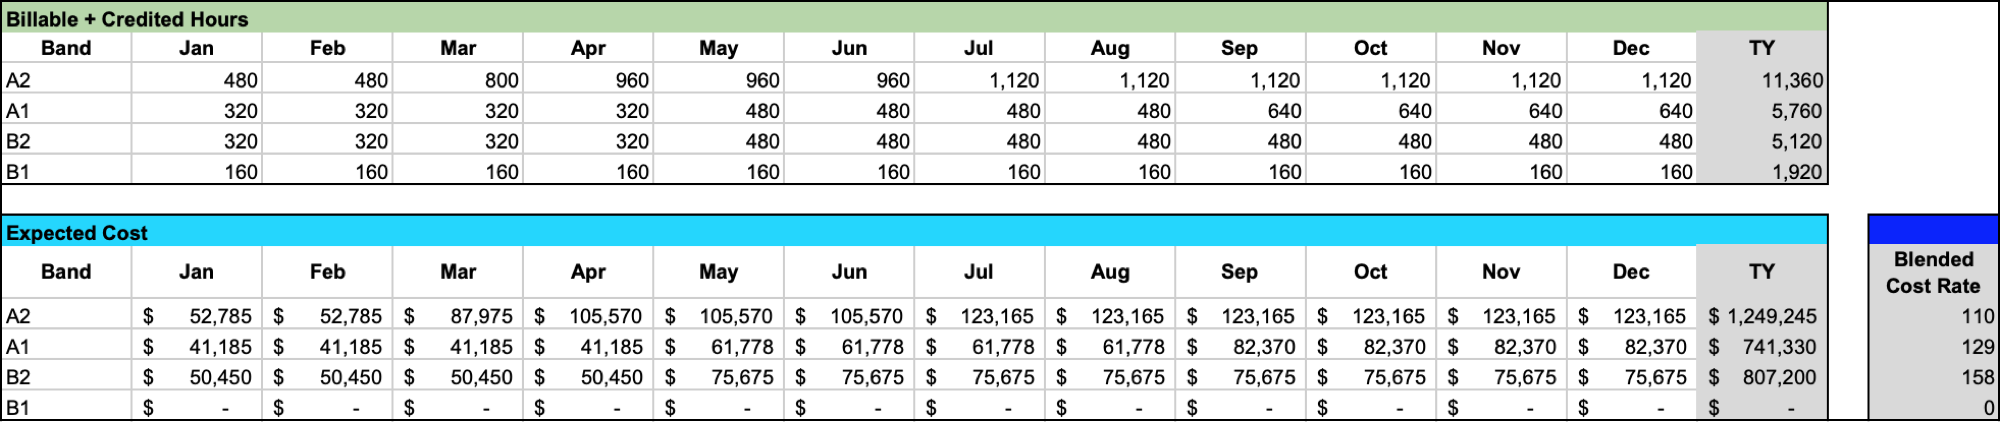
It’s Time to Work Smarter
We believe that implementing a PSA tool is not just a change in technology for the organization. It is an opportunity to improve, mature and work smarter. Our consultants have vast experience helping enterprises walk through decisions just like these that arise when implementing Professional Services Automation and Accounting solutions.
If you are interested in taking a closer look at the excel logic or would like the source file sent to you, contact us to get started analyzing your actual resource cost rates in order to create average resource cost rates.
CLD Partners specializes in enterprise FinancialForce implementations and enterprise quote-to-cash solutions on Salesforce. The post above is just a simple model to get organizations thinking about how the blended cost rate can be calculated. And, since we understand it’s a simplification, we recommend checking with your Finance and Accounting department before making changes. It’s important to discuss with them in case there are other factors of which you may not be not aware. Sometimes there are implications that will potentially alter the model as well.